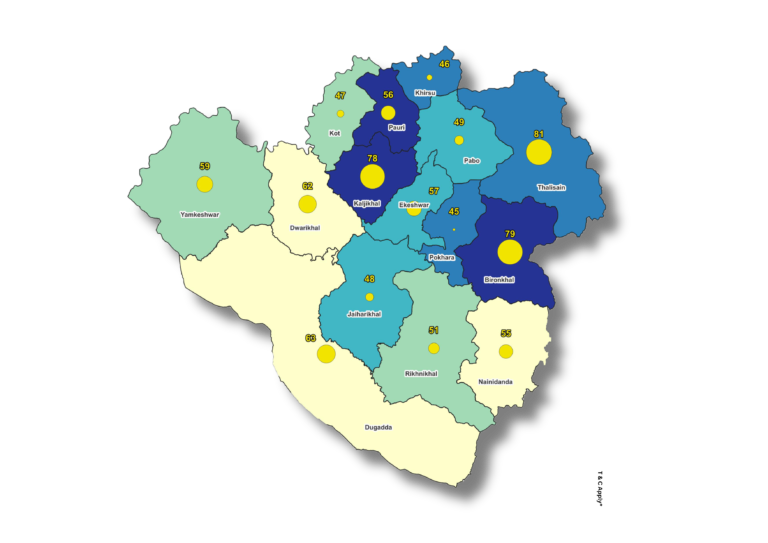
This map visualizes variations in economic drivers such as livelihood sources, income-based migration, or employment dependency across regions. By linking survey data with spatial distribution, it highlights areas influenced by agricultural labor, industrial jobs, or remittance-based economies—crucial for development planning and targeted interventions.
Map what drives livelihoods—understand economic motivation to inform action.
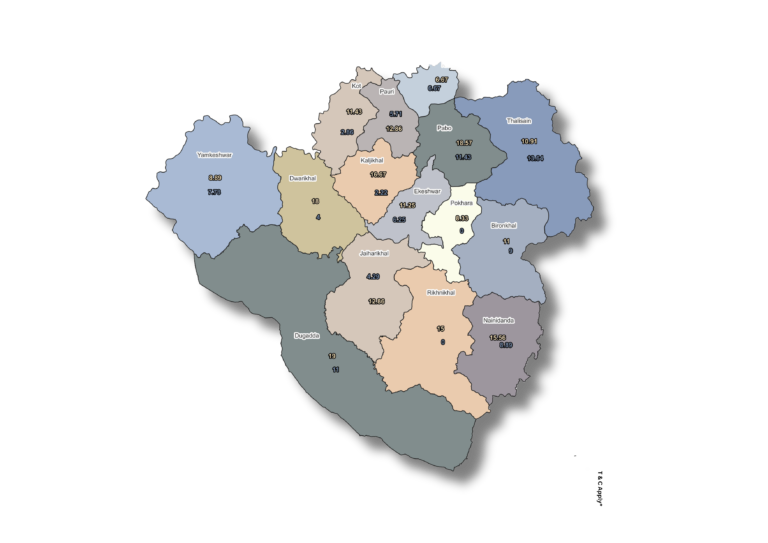
Migrant Population Mapping
We map patterns of seasonal and permanent migration by integrating field survey data with spatial boundaries. This helps identify source and destination zones, migration intensity, and its impact on labor, land, and social systems, enabling better planning of services and infrastructure.
Track movement that matters—map migration to shape inclusive development.
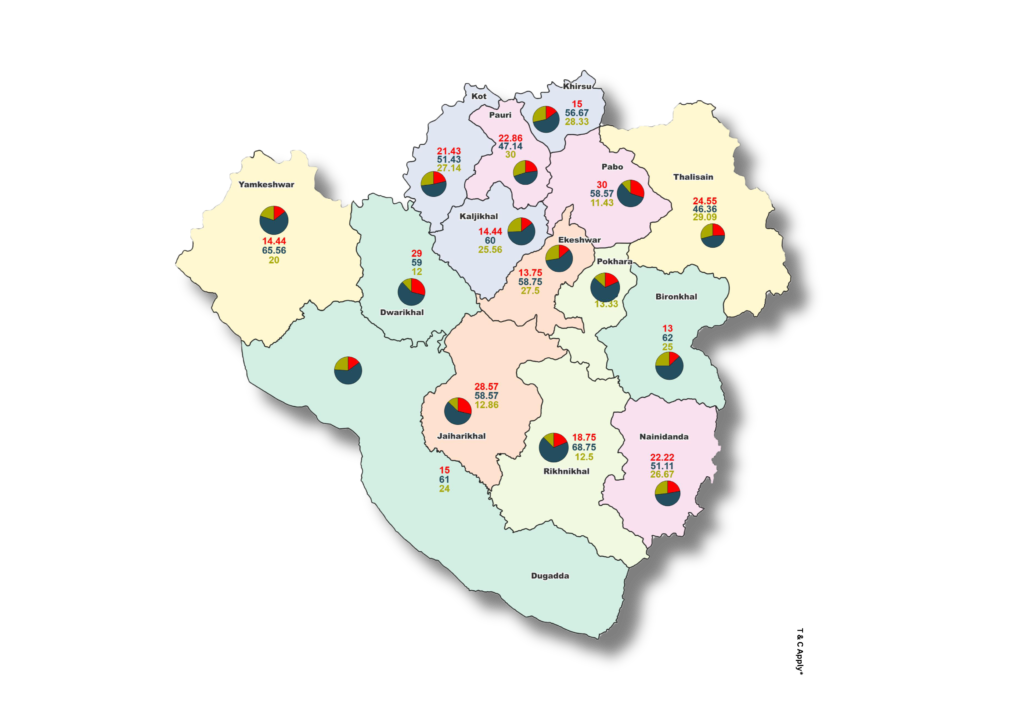
Adoption of Technology
This map showcases the geographic spread and gaps in adoption of technologies—like mobile phones, irrigation systems, or renewable energy—across communities. Understanding where innovation is embraced or lags helps in designing outreach, subsidies, or capacity-building programs.
Visualize progress—map technology adoption to close digital and development divides.
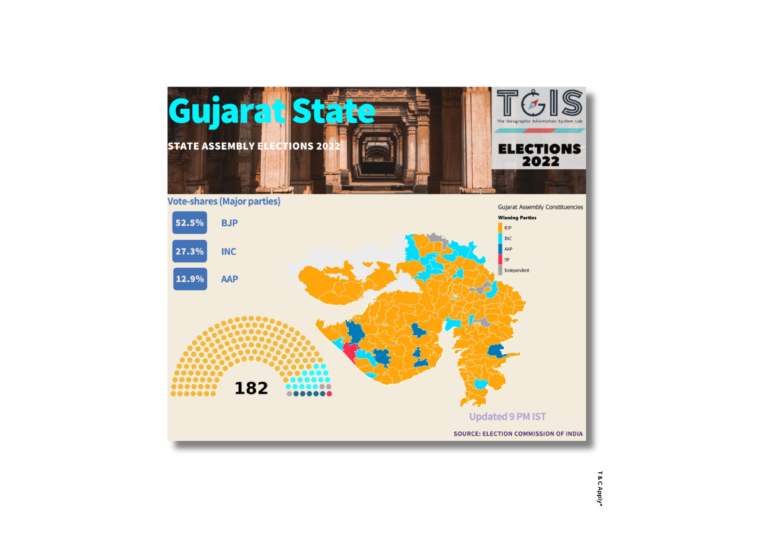
Election Mapping
Election mapping visualizes voter demographics, turnout patterns, and party-wise voting trends at various administrative levels. By linking electoral data with socio-economic indicators, these maps support political analysis, campaign planning, and democratic engagement strategies.
Map the mandate—turn electoral data into insights for informed civic strategy.
Economic Motivation Mapping
This map visualizes variations in economic drivers such as livelihood sources, income-based migration, or employment dependency across regions. By linking survey data with spatial distribution, it highlights areas influenced by agricultural labor, industrial jobs, or remittance-based economies—crucial for development planning and targeted interventions.
Map what drives livelihoods—understand economic motivation to inform action.
Migrant Population Mapping
We map patterns of seasonal and permanent migration by integrating field survey data with spatial boundaries. This helps identify source and destination zones, migration intensity, and its impact on labor, land, and social systems, enabling better planning of services and infrastructure.
Track movement that matters—map migration to shape inclusive development.
Adoption of Technology
This map showcases the geographic spread and gaps in adoption of technologies—like mobile phones, irrigation systems, or renewable energy—across communities. Understanding where innovation is embraced or lags helps in designing outreach, subsidies, or capacity-building programs.
Visualize progress—map technology adoption to close digital and development divides.
Election Mapping
Election mapping visualizes voter demographics, turnout patterns, and party-wise voting trends at various administrative levels. By linking electoral data with socio-economic indicators, these maps support political analysis, campaign planning, and democratic engagement strategies.
Map the mandate—turn electoral data into insights for informed civic strategy.